How the Wealthiest of America's Rich Make Their Money

Cries of “We are the 99%” from Occupy Wall Street protestors shined the spotlight on the wealth and power of America’s top one percent. As Nobel Prize-winning economist Joseph Stiglitz explained in a May 2011 article in Vanity Fair, the “upper 1 percent of Americans are now taking in nearly a quarter of the nation’s income every year” and they control nearly 40% of the country’s wealth. These wealthy people have been doing increasingly well. A quarter of a century ago, the top one percent claimed, overall, 12 percent of yearly income and held a third of national wealth. As Stiglitz explains, “all growth in recent decades – and more – has gone to the very top.”
Other social scientists have joined in focusing on the top one percent, and this attention is all to the good. But what about the very wealthiest Americans within that top one percent? The top one-tenth of one percent has long received at least half of all the income flowing to everyone in the top one percent. What can we learn by comparing these very wealthy Americans to the rest of the wealthy, now and in previous decades? I look at amounts and sources of income to get a better fix on the top of the top.
How Well-Off are the Rich and the Very Rich?
To get a sense of the astronomical incomes normally earned at the top of the U.S. income ladder, we can look at the year 2007, just before the onset of the recent Great Recession (from which the wealthy have since recovered faster than other Americans).
- In 2007, $407,056 was the average income of households at the lower boundary of America’s top one percent; and the average income at the divide between the 99.9 percent and the top one-tenth of one percent was $2,065,541.
- In 2007, all “very rich” households in the top one-tenth of one percent earned nearly $4.5 million on average; and the “rich” households in the rest of the top one percent averaged just over one million dollars. By 2010, the very rich households averaged $4.9 million in income, and the rich households were still earning just over one million per year (a tad more than in 2007).
- To offer some perspective on these income levels: over the 2007-10 period, the least affluent 90% of U.S. households made $30,000 a year on average; those between the 90th and 95th percentiles averaged $130,000 a year; and households between from the 95th through the 98th percentiles took in an average of $210,000 a year.
- Since World War II, the share of all top one percent income flowing to the very rich 0.1 percent has varied between a fifth and half. This is to say, the income share of the very rich has equaled between 40% and 100% of the income share repeated by the rest of rich Americans between the 99th and 99.9th percentile. The income take of the very rich sliver equaled the share of the rest of the top one percent in the year 2000 and again from 2005 through 2008.
Income Sources at the Top
Most Americans earn their incomes from wages and salaries. To earn their daily and yearly bread, they go to work at job-sites and offices. But the rich are different; they get big parts of their incomes from business profits and capital gains. And investment income from capital gains is even more pronounced for very rich households, for the top ten percent of the one percent.
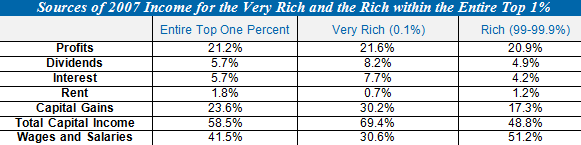
This table uses data from economists Thomas Piketty and Emmanuel Saez to detail the specific sources of 2007 income flowing to all U.S. households in the top one percent. It also compares income sources for the very rich top 0.1 percent of households to sources for other rich households in the top one percent.
The top one percent of U.S. income-earners got only about two-fifths of their 2007 incomes from wages and salaries, and obtained close to three-fifths from all kinds of capital income, including profits, dividends, interest, rent, and capital gains. But compare the sources for households within the top one percent. The very rich earned almost 70% of their 2007 incomes from capital income sources. In short, the very richest 0.1% of households are not just earning a lot more each year than all other Americans, including the rest of the well-to-do. These very wealthy households are getting more than two-thirds of their earnings from profits, rent, and other kinds of capital gains. Some of these people may be employed in highly paid managerial positions, but all are keeping a keen eye on corporate profits, property rents, and the stock and bond markets.
So What?
Pinning down how the fattest American fat cats make their money matters because distinct sources of income lead to different interests and political capacities. A study by Thomas Volscho and Nathan Kelly published in the October 2012 American Sociological Review sorts out various causes behind the skyrocketing wealth of the very richest Americans since World War II. Among the key causes fingered by these authors are the rise of financial manipulations and speculation in asset bubbles in stock and real estate, along with new levers of political power available to the very wealthy, to help them lobby for favorable regulations and low tax rates on high incomes and capital gains. All well-to-do Americans have no doubt had a hand in these developments, but the richest ten percent of the top one percent have been in the vanguard. Very rich Americans have shaped our economy and manipulated U.S. politics to reap increasingly opulent rewards for themselves compared to everyone else, including the merely rich.